

Marketing
2026 Student Satisfaction Hits a 3-Year High
Notable stats from this year's Student Voice Score® report
If you work in higher ed, you already know the headlines: the enrollment cliff, financial strain, AI disruption, growing public skepticism about the value of a degree. Given all that, we went into our annual Student Voice Score® analysis expecting to find satisfaction slipping right along with it.
Instead, we found the opposite – student satisfaction continues to rise. The 2026 Student Voice Score (SVS®) Report — based on direct feedback from over 125,000 students across 257 institutions — shows student satisfaction has climbed for three straight years.
But the fuller picture is more nuanced than "things are getting better." Underneath that trendline, there's a lot of detail about where institutions seem to be delivering, where students are still running into friction, and which student populations aren't seeing the same gains as everyone else.
Below, we highlight some key findings that are especially valuable as you think about your own student success priorities for the year ahead. For more, we encourage you to download the full report.
Satisfaction is trending up across the board
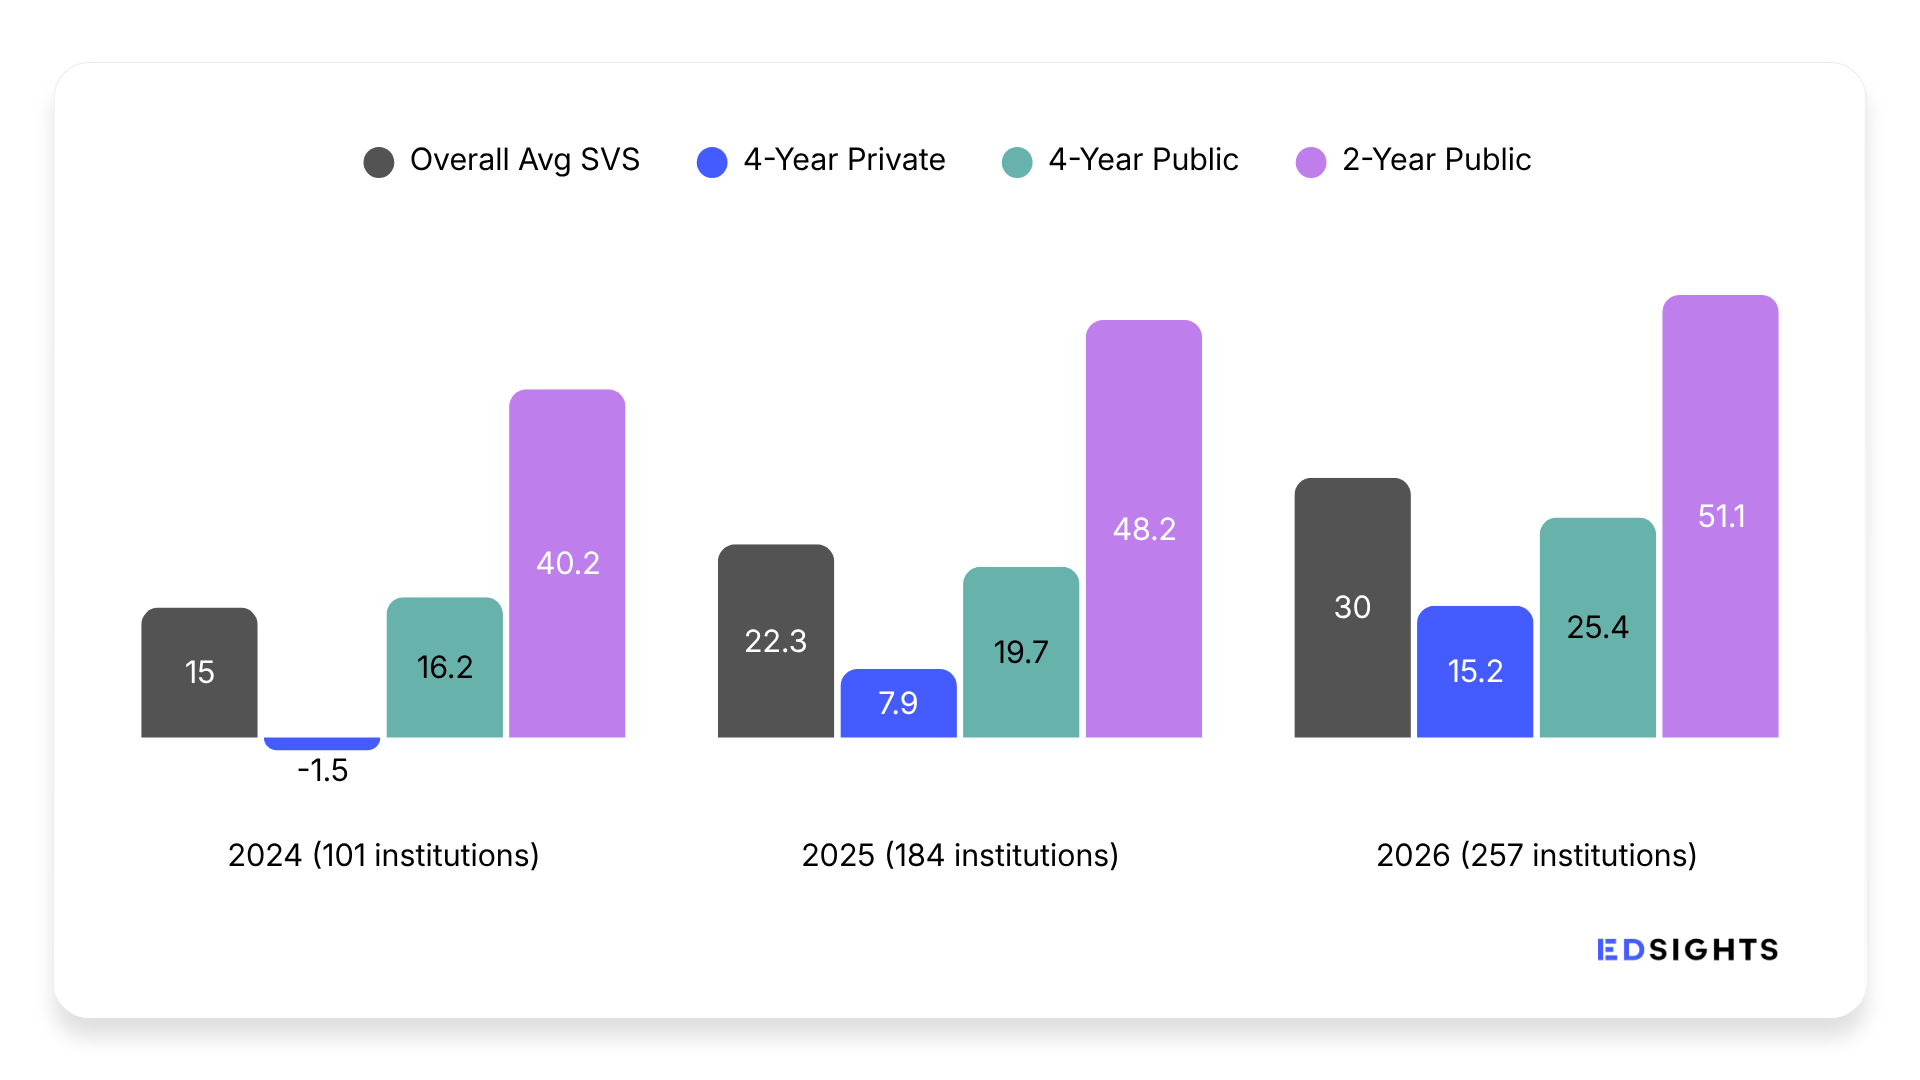
SVS is calculated the same way as Net Promoter Score: ask students how likely they are to recommend their school, then subtract the percentage of detractors from the percentage of promoters. Since we started benchmarking it in 2024, the average score across all participating institutions has moved from 15.0, to 22.3, to 30.0 this year. All three institution types — 2-year public, 4-year public, and 4-year private — are trending up.
One student population reports notably lower satisfaction
Student-athletes report the lowest satisfaction of any group in this year's data. At 4-year private institutions, athlete SVS is actually negative, at -5.6. Even at 4-year public and 2-year public institutions, athletes report roughly half the SVS of their non-athlete peers.
.png)
This pattern has held across multiple years of reporting, with athletes often pointing to disappointment around program resources and team dynamics, and describing feeling unsupported or unable to balance their sport with their coursework. It's worth institutions' attention, and the full report breaks down how it plays out sector by sector.
Off-campus students tend to be more satisfied
At 4-year private institutions, students living on campus report satisfaction 59% lower than their off-campus peers, which stood out to us given how much this sector tends to emphasize residential community. The report explores some possible reasons why proximity to housing, dining, and campus services might work against satisfaction rather than for it, and what that could mean for schools built around a high-touch, residential experience.
.png)
A few complaints show up across sectors, but not in the same way
Regardless of institution type, students often mention the same handful of friction points: cost and financial aid clarity, administrative communication, and facilities not matching expectations. How those complaints show up, and how much weight they carry, looks different depending on whether you're a 2-year public, 4-year public, or 4-year private institution. Ultimately, it comes down to student expectations and how closely their experience aligns. For example, a student paying top dollar for a 4-year private institution may have higher expectations over elements like housing and dining hall quality, thus showing a larger gap in satisfaction.
The report also includes real, anonymized student quotes for each theme, sector by sector, to paint a clearer picture of students’ perspectives this year.
Why this matters
We’re all about celebrating the wins, and the overall satisfaction increase year-over-year is a big win for higher ed. Where listening to student voice becomes even more powerful, though, is when schools can dive deeper into the trends for their own student population and benchmark it across years, student groups, and similar schools. Not all students are thriving, and for teams focused on student persistence and retention, being able to dig into the “why” behind a student’s struggle is the best way to understand how to help.
Download the full 2026 SVS Report for the complete sector breakdowns, demographic data, the full Honors List, and qualitative themes drawn from over 125,000 student responses.


Experience the Future of Student Success


